Omega-3 Index — EPA + DHA in Red Blood Cells
The omega-3 index measures EPA + DHA as a percentage of total fatty acids in red blood cell membranes. Strong inverse association with cardiovascular mortality. Target 8–12%; most Western adults sit at 4–6%.

The omega-3 index measures EPA + DHA as a percentage of total fatty acids in red blood cell membranes — a tissue-level snapshot of long-term omega-3 status that reflects months of intake, not last week's salmon. It has a strong inverse association with cardiovascular and all-cause mortality across multiple large cohorts, making it one of the most actionable single numbers you can track.
The biomarker
- Name: Omega-3 Index (EPA + DHA in RBC membranes)
- Units: % of total fatty acids
- Standard range for most Western adults: 4–8%
- Optimal target: 8–12%
How to read your result
| Value (%) | Interpretation |
|---|---|
| < 4 | High cardiovascular risk zone |
| 4–8 | Average — where most Western adults sit; room to improve |
| 8–12 | Protective range — target to reach and maintain |
| ≥ 12 | High — no clear added benefit; possible bleeding risk at very high levels |
What moves the needle
- Diet first. Fatty fish (salmon, mackerel, sardines, herring) 2–3 times per week is the most reliable dietary path to the 8–12% range for most adults.
- Supplement quality matters. If using an EPA+DHA supplement, choose a third-party tested brand for oxidation (rancid fish oil does not raise the index). Dose varies by individual — see your source for guidance; this is not a case where "more is always better."
- Retest window: RBC turnover takes ~120 days; retest 4 months after any dietary change to see the new plateau.
- ALA from plants (flaxseed, walnuts) does not reliably raise the index — conversion to EPA/DHA in humans is low and variable. Marine sources are required.
Why this test is worth asking for
- The omega-3 index reflects actual tissue incorporation, not just dietary recall — it is what your cells are made of, not what you report eating.
- Most adults eating a Western diet sit at 4–6%, well below the protective range, with no subjective symptoms of deficiency.
- The test closes the loop on dietary changes: you can eat more salmon for a month and feel nothing; the index, retested 4 months later, tells you whether the change actually reached the cell membrane.
This is not a number you can estimate from your diet — the finger-prick kit I use is how I get mine.
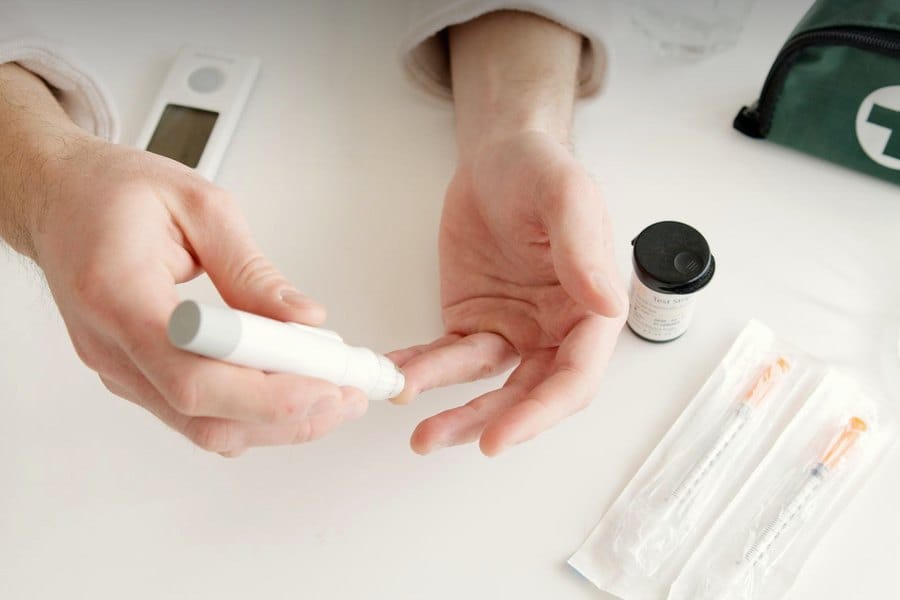
Omega-3 Index Home Test
A finger-prick home test that measures the EPA+DHA content of your red blood cells — the omega-3 index — so you can dose fish oil to a target instead of guessing.
See it in the shop →Illustrative photo. We may earn a commission — the affiliate link and the full disclosure live on our shop page.
Related protocols
- Lp(a) — Genetic Cardiovascular Risk
- Lipid Panel — LDL, HDL, Triglycerides
- hs-CRP — Systemic Inflammation
Sources
AgeGen lab guides are educational only. We do not provide medical diagnosis, prescribe brands, or recommend specific doses. Talk to a licensed clinician before changing your supplement or medication routine.